The making of Satellite Stories
Science generates a wealth of data on wildlife for conservation purposes each day. What if we opened up some of that data to tell some of the amazing stories of the wild, and get more support for wildlife conservation? Our new project, Satellite Stories, is an experiment in opening up scientific data to create an engaging interactive product for broader audiences.
Satellite Stories - Ol Pejeta is an interactive data visualization of the Ol Pejeta Conservancy as told through movements and stories of the animals that live there. It is intended to be the first in a series of visualizations that give the user an alternate look at the world’s wildlife hotspots and spectacles. We developed Satellite Stories over the course of four months together with partner Ol Pejeta, made possible by a grant from the National Geographic Society. Check out the finalised product here.
Through the use of actual and modeled GPS data over a course of 7 days, the user sees the movements of over 3,000 individual animals across 11 different species, leveraging over 1.7 million data points. He/she explores the park using a mouse or keyboard controls, zooming out to get a birds eye view of life in the park, or zooming in to follow the progress of just one animal or a particular herd. The experience is supplemented by 7 narrated stories that call attention to interesting behavior that can be gleaned by watching the movement data.
While most data visualizations are relatively static in nature or a passive experience for the user, Satellite Stories aims to capture the audience’s attention and invite them to self-explore, learn a little more about wildlife movements and behavior patterns, and draw some of their own conclusions through the experience.
THE USER EXPERIENCE
Satellite Stories - Ol Pejeta is accessible through a standard browser and works without requiring the user to install anything. While satellitestories.io loads we give visitors a glimpse of what’s coming… as pride, coalition and bloat data arrive, soon followed by spatial data and the processing of smoothing algorithms. The viewer is first met with a birds-eye view representation of Ol Pejeta Conservancy, from a high elevation,and within seconds the camera has zoomed down much closer the ground, and starts to pan and fly across the 3D terrain, while the experience is introduced by our narrator.

The side bar where users can select stories and species
While viewers explore they can find stories to watch. These are specific events in the visualized data that we have focussed in on and explained. These are highlighted on the terrain itself, at the moment they happen, and can also be accessed from the side-menu. We highlight specific animals, areas and features during a story to help it makes sense, and all the stories are subtitled for visitors who can’t rely on audio. We tell stories of Hungry Hippos, examining hippo’s surprising nocturnal foraging activity, or a ‘night in the life’ of a particularly mischievous elephant, who regularly breaks through fences into adjacent farms for midnight feasts on their crops.
OUR GOALS AND OBJECTIVES
This project set out to create an alternative approach to wildlife storytelling, one in which animal movement patterns are front and center, and that through those patterns, stories of both the animals as well as their habitat become front and center for the user. We wanted to go beyond the common static heat maps which are informative but unengaging as well as the film-like visualizations which have flair but don’t provide the opportunity for the user to dive deeper.
We wanted to achieve the above without heavy production costs associated with nature documentaries yet create an opportunity to convey informative, anecdotal, and moving messages nonetheless.
Finally, it was our objective to create an experience that could be replicated for different biodiverse locations throughout the world, or for particular wildlife phenomenons such as the great sardine run or Alaskan caribou migration. By creating a system to develop further ‘episodes’, and further iterating on features, design, and data analytics, we can advance storytelling techniques to appeal to ‘modern conservationists’ around the world and do it in a cost-effective way that allows for a steady stream of varying experiences.
DEVELOPMENT PROCESS
Satellite Stories was created in four stages.
Pre-production and R&D: concept development, choice of platform, and research of tools that are specifically set up to handle thousands of individual objects, each moving around independently on 3D terrain. We dove into the data to select which stories we wanted to tell and proved out the core features to work on any typical machine users might access the product with.

Production Private Release 1:
The first release was a private version of Satellite Stories - Ol Pejeta to present to the team at Ol Pejeta and get their feedback on the animal movement to ensure we have an accurate representation.

Production Private Release 2:
The second release was another private release, but designed to test the overall experience with members of our target audience.
This release presented a fully developed visual identity and user interface, and include one fully narrated story to test. These elements would allow us to test with our audience if they understood what Satellite Stories is and what it can do, the usability of the interface, the enjoyment, and engagement with the content, the desire to explore more, and the preferences for our shortlisted Voiceover Auditions.
Final release Final data refinement and creation of the high-resolution story-specific movement, all the story scripts, recording of voice-over, optimizing loading and performance, improving the design of the user interface and implementing the changes, finishing the story editor and final design touches.
KEY PROJECT PRINCIPLES
We’d like to share some of the key principles that underpin the project for anyone who, like us, is looking to engage broader audiences through data.
1. REMOVE ALL BARRIERS TO ACCESS
If we want as many people as possible to dive into interactive conservation stories, we don’t want anything standing in the way. We built Satellite Stories in such a way that there are as few barriers as possible to get into the content. No fancy apps to download, and no special software to install. You can access the product through any browser, see the movements and listen to the stories of elephants, rhinos or hippos.
2. GIVE THE USER CONTROL OF THE STORY
While most data visualizations are relatively static in nature or a passive experience for the user, Satellite Stories aims to invite the audience to self-explore, learn a little more about wildlife movements and behaviour patterns, and draw some of their own conclusions through the experience. The users literally have their fingers on the controls to navigate through Ol Pejeta conservancy. They can choose what they want to see and when they want see it.
3. SPEAK TO THE PEOPLE BEHIND THE DATA
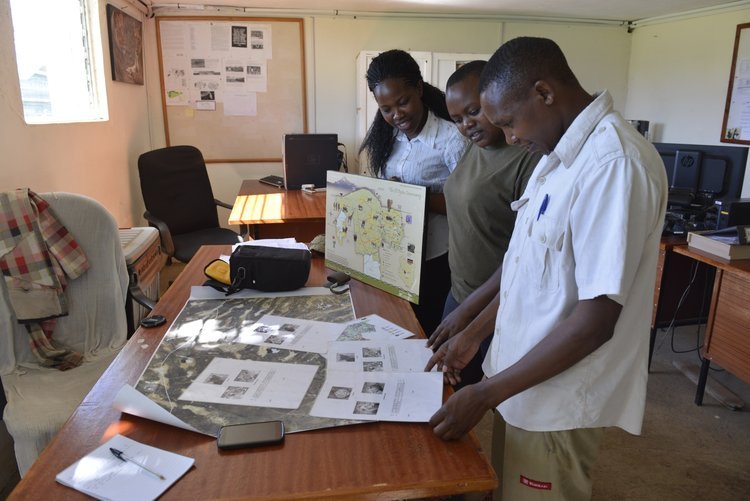
We didn’t just copy-paste the data from our conservation partner into the design. Our data scientist Raff Mares traveled to Ol Pejeta and spent time with the team of conservationists and rangers who know the area and the animals intimately. Of course this is done to ensure our visualisations are as accurate as possible, but also to aid the editing process. There are simply too many data points to choose from, and the Ol Pejeta team knows the stories behind the zeros and ones. Raff visited key sites within the conservancy (for instance the wildlife corridors) to hear the stories, select the most meaningful ones and obtain animal and landscape data.
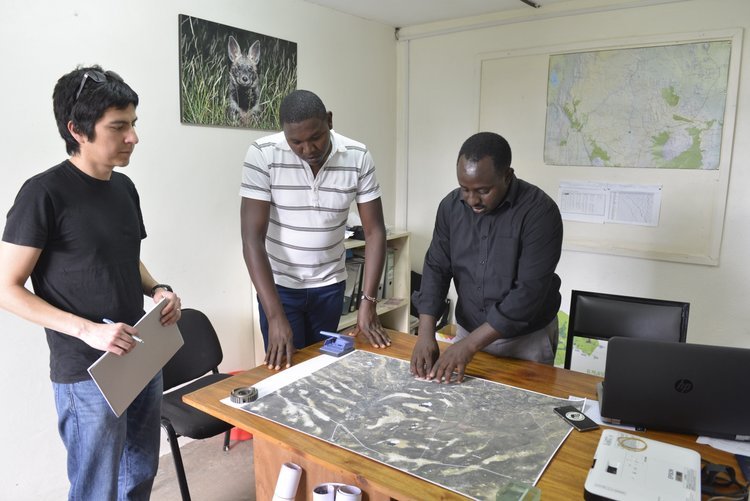
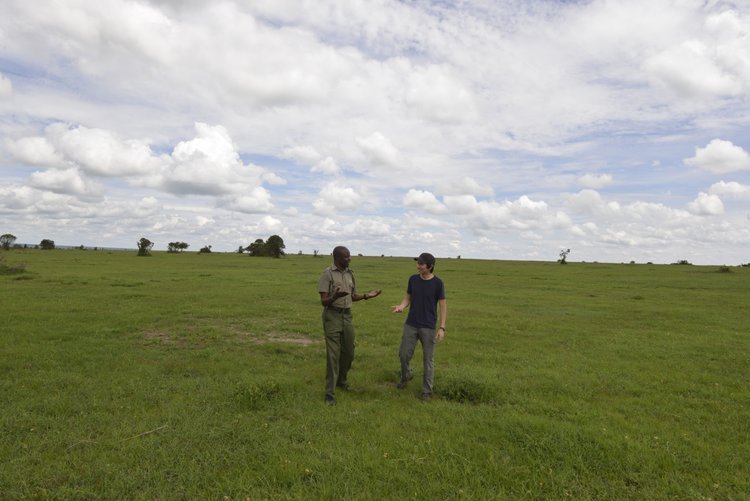
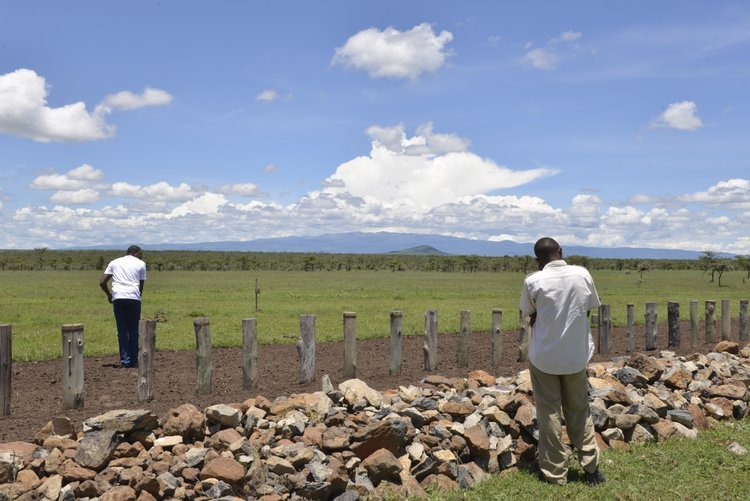
While the data that went into Satellite Stories could have been obtained remotely - for example, numbers and distribution of a particular animal species - our decisions on which areas of the conservancy, species and stories to focus on were greatly influenced by the lengthy conversations with Ol Pejeta staff on site, and our own experience and perception of the conservancy and its wildlife. As a result, and because of the timescale the medium allows us to work with, we tell stories that are unexpected and different to those of the general wildlife tv show or documentary.
4. TEST, TEST, TEST, AND TEST AGAIN
At IoE we are big believers in lean product development, so it is second nature to test our products. This can be tough, as you are putting your product in front of people to shoot holes into, and that can hurt even the most seasoned designer. We’ve found it is critical to test products in an early stage while it is still incomplete in features and content, so we can incorporate feedback in a meaningful way. If you don’t take a little pain early, you will take a lot of pain later if the product fails to engage people, so we bite the bullet.
The test guided our approach to planned features like the intro sequences, and highlighting known and unknown usability problems early so we still had time to fix them.
We checked the first release with Ol Pejeta Conservancy staff to get their feedback on the animal movement to ensure we have an accurate representation. We then ran a second private release with limited content to test the overall experience with members of our target audience. We got a lot of feedback on crucial points.

A Satellite Stories focus groups at Columbia University
People loved the choice of narrator - using a ‘local’ voice steps outside of what people normally expect with conservation products. People said it was the right length of experience - “can enjoy it over a cup of coffee”,
and saw great potential to tell other wildlife and conservation stories (such as the creation of wildlife corridors in Florida, or the impact of wind turbines on raptor populations in Kenya).
But it was also clear that the user interface gave the impression of a linear narrative, instead of one where the user decides, so this became a top priority for adjustment. Test users also told us the user interface was not intuitive enough (crucial to our project!) and the ‘on ramp’ was too steep: people did not know ‘what to do’ after the browser loaded the product. These test outcomes were great input for what we needed to prioritize moving forward.
5. CUSTOM DESIGN IT IF NEEDED
Out of principle and necessity, at IoE we work as lean as we can. If there are plugins or other pieces of existing code out there that we can use, we will. But if open-source or (in)expensive third-party code doesn’t work for us, we will choose writing our own code over poor performance. One of the major challenges was creating a system to move all the 6000 animals at once. Their movements are synced to time, allowing a user to skip backward and forwards using the timeline. The high number of animals in the simulation resulted in a lot of processing time. This became a concern as more features were added to the project. The code used to move the animals had to be optimized as much as possible to make the user experience better. Initial tests using a third-party plugin did not work out and we decided to develop a custom movement system. This worked better and was easier to use.
6. TO MAKE ENGAGING PRODUCTS, BUILD A DIVERSE TEAM
The Satellite Stories team is composed of data scientists, game geeks, animal lovers, and conservationists to make a unique product rich in content and at the same time fun and easy to use. Our ability to combine compelling content with accurate data representation and a great design could not come about any other way. This has become a foundational principle in our quest to engage a wider audience: the reach of your product is almost pre-destined by the diversity of the people who design the product.
WHAT’S NEXT?
Satellite Stories was launched to the public in January 2019.
Satellite Stories Ol Pejeta is only the beginning of what we hope will be a series of interactive products that tell wildlife stories from all corners of the world, like the impact of polar ice in the Arctic on polar bears, the great sardine run or the wildebeest migration and impacts of fencing.
If you want to discuss how we could partner with you to bring your species data, conservancy, or park to life in the digital realm, please contact gautam@internetofelephants.com
If you want to keep up to date on the results of the experiment, or new iterations, please sign up for our newsletter.